- Home
-
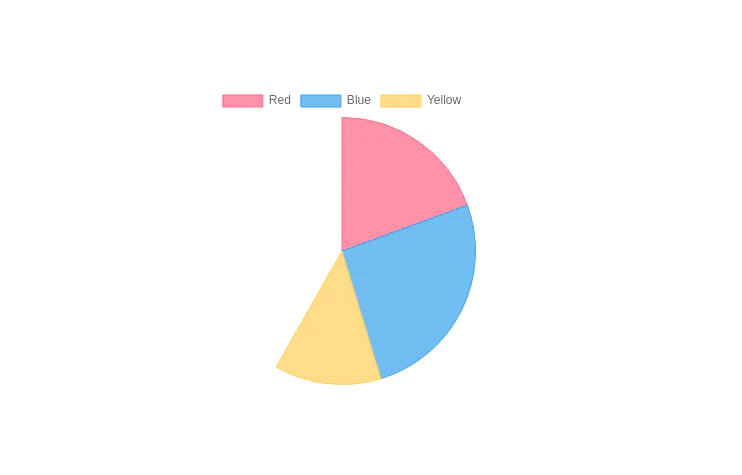
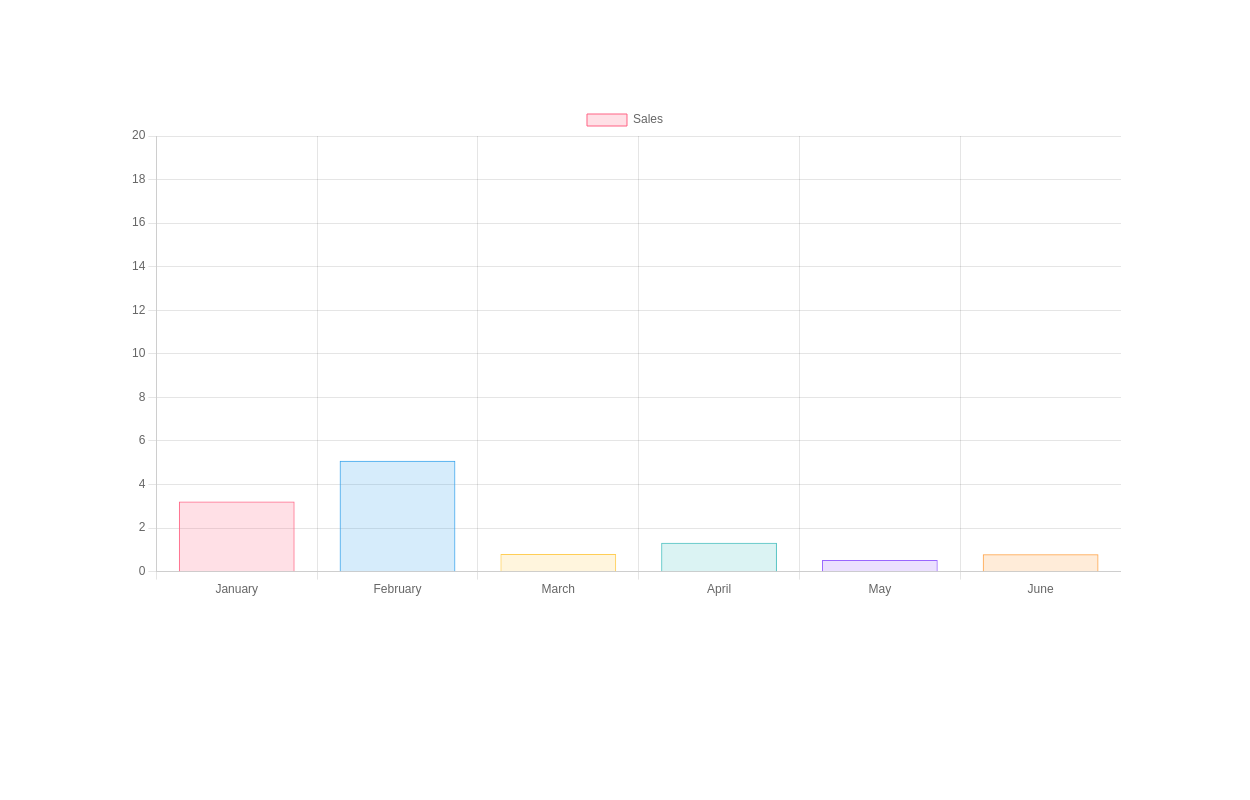
Line chart with chart.js and tailwind css
Line chart with chart.js and tailwind css
This tailwind example is contributed by Kairi Greene, on 03-Jan-2023. Component is made with Tailwind CSS v3. It is responsive. similar terms for this example is Graph

Author Kairi Greene
Related Examples
-
2 years ago12.4k
-
2 years ago12.5k
-
Daily growth chart
chart for showing data each day of the week
2 years ago10.7k -
2 years ago10.5k
-
2 years ago11k
-
1 month ago54
-
Chat UI
The Chat UI is a responsive and interactive component designed for building messaging interfaces. Ideal for applications like customer support, social media, or team collaboration tools, it provides a modern, user-friendly layout for real-time communication.
5 months ago1.4k -
Interactive Order Report Chart with TailwindCSS and Chart.js
Create a stunning and interactive order report chart using HTML, TailwindCSS, and Chart.js. This chart combines bar and line graphs to visualize delivered, shipping, cancelled, and returned orders effectively. Perfect for dashboards and analytics pages with responsive design and clean aesthetics.
4 months ago854 -
1 year ago8.6k
-
Header with logo, menu and buttons
Header with logo, menu and buttons. If you want to toggle the visibility of the mobile menu when clicking on the hamburger menu icon you can achieve this with JavaScript by adding and removing a class that controls the visibility of the mobile menu
1 year ago3.6k -
Beautiful CTA w/ large buttons
This CTA card also has a features list
1 year ago1.9k -
Modern responsive Newsletter form
Responsive newsletter subscriber form
1 year ago1.9k
Explore components by Tags
Didn't find component you were looking for?
Search from 2400+ components


