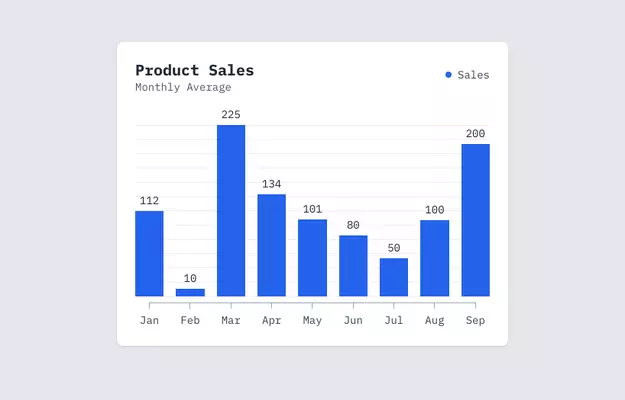
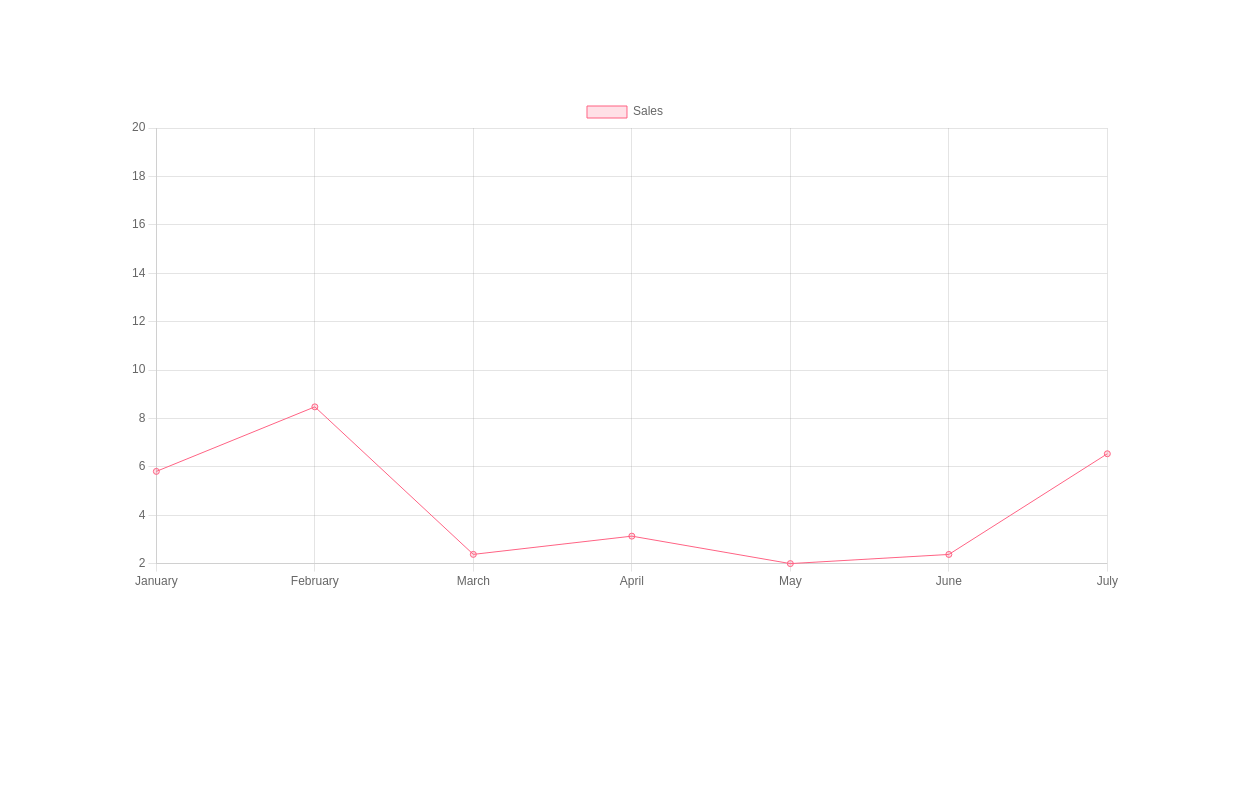
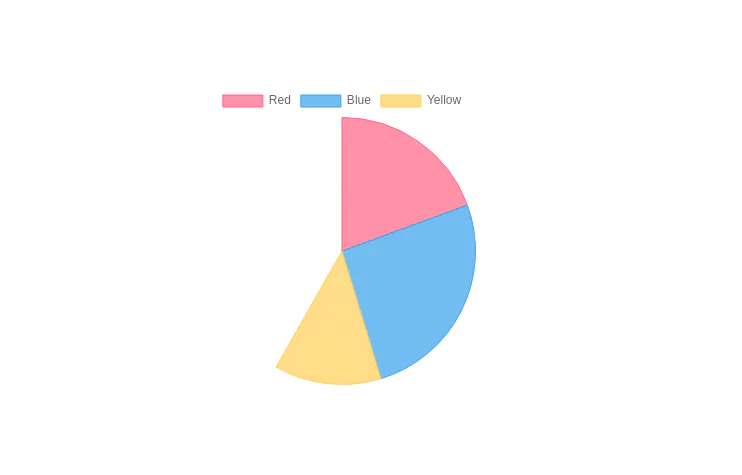
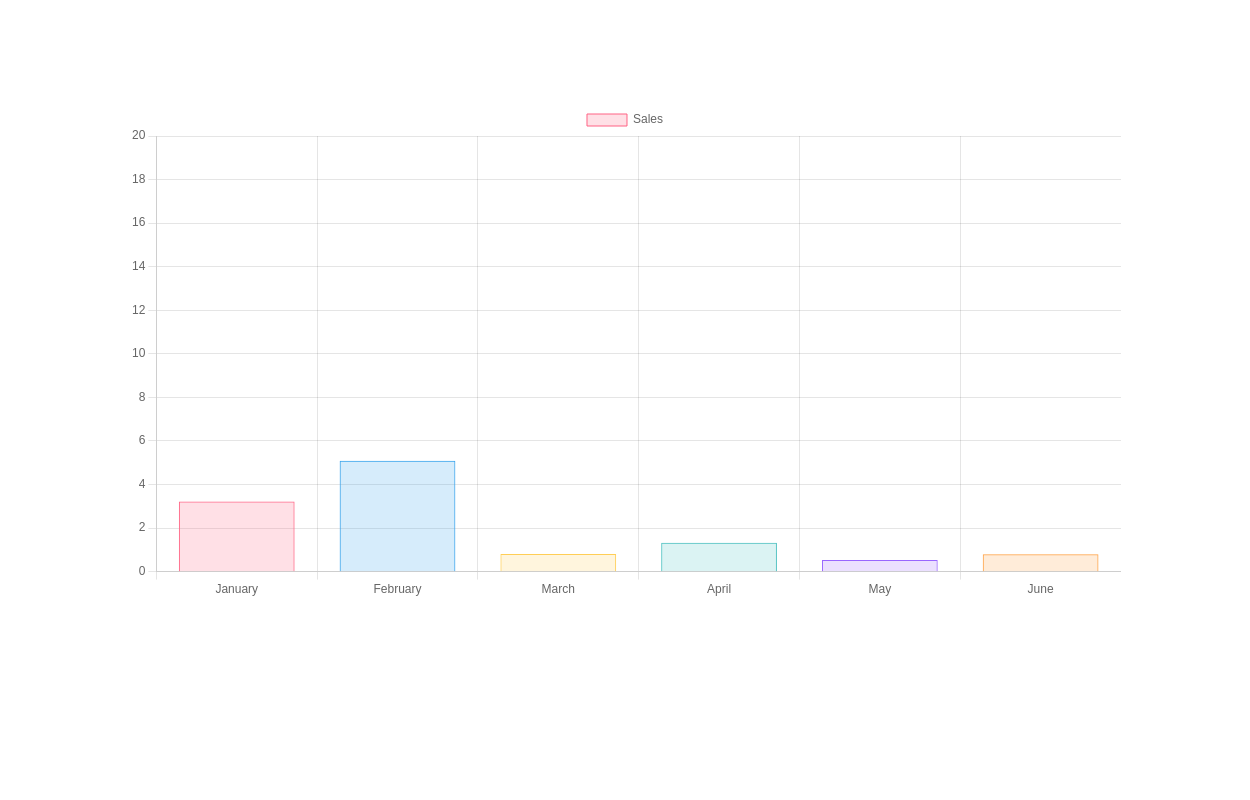
Daily growth chart
chart for showing data each day of the week
This tailwind example is contributed by Samuel Dawson, on 05-Jan-2023. Component is made with Tailwind v3.4. It is responsive. similar terms for this example are Info, Show info, Statistics,Graph

Related Examples
-
-
-
-
-
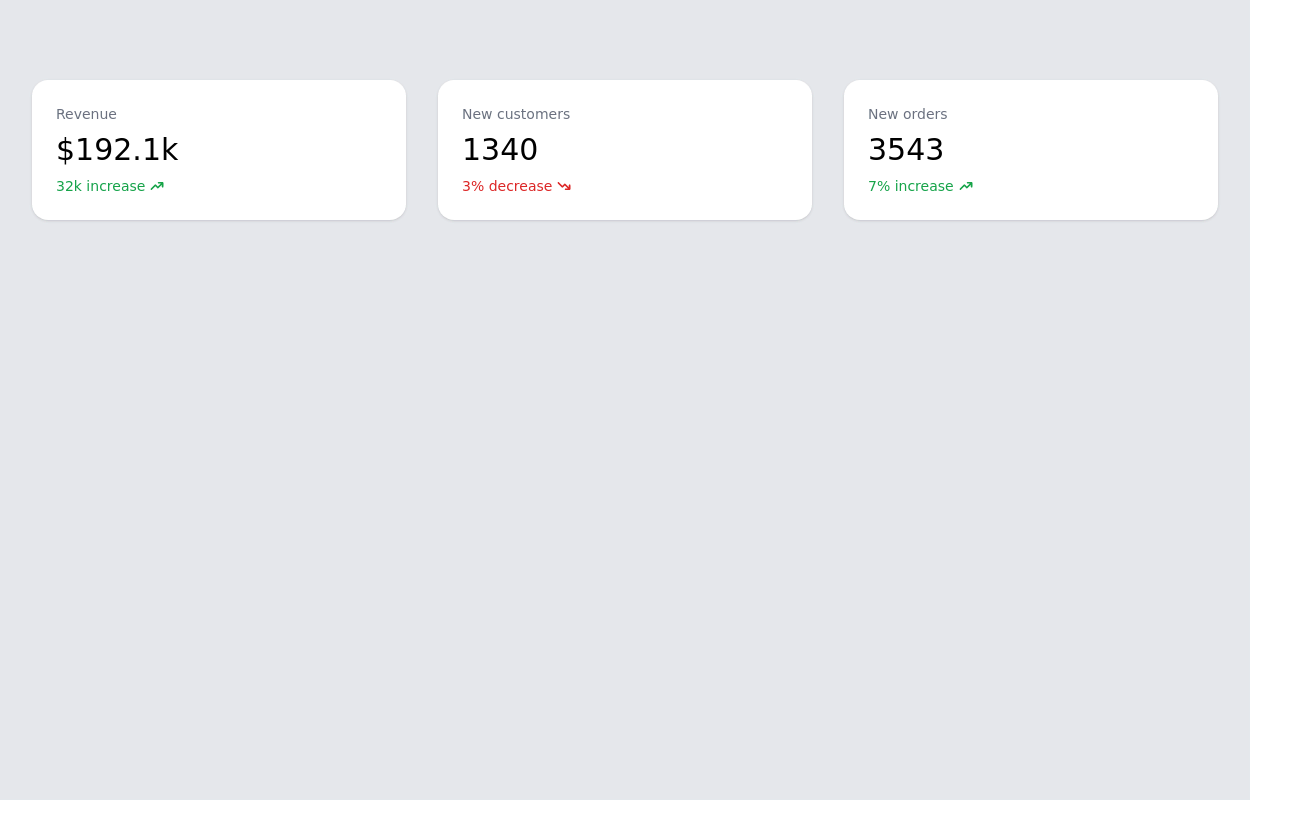 Responsive Info cards for admin panel
Show stats to the admin dashboard
12.9k -

-
 Dash.OS: Drag & Drop Dashboard Widget System
A fully interactive, freeform dashboard builder for the browser. Drop in widgets, drag them anywhere, resize to fit, and your layout is automatically remembered. Ships with a live Chart.js revenue chart, KPI stats, a task tracker, and a notifications feed, all in a single zero-dependency HTML file with dark/light mode built in.
992 -
 Stats Banner Example
Show your stats proudly
2.8k -
 Data Metrics Showcase
An information panel designed to instill trust, presenting vital statistics about a service or product. The grid layout offers a clean and organized look for displaying key data.
9.1k -
-
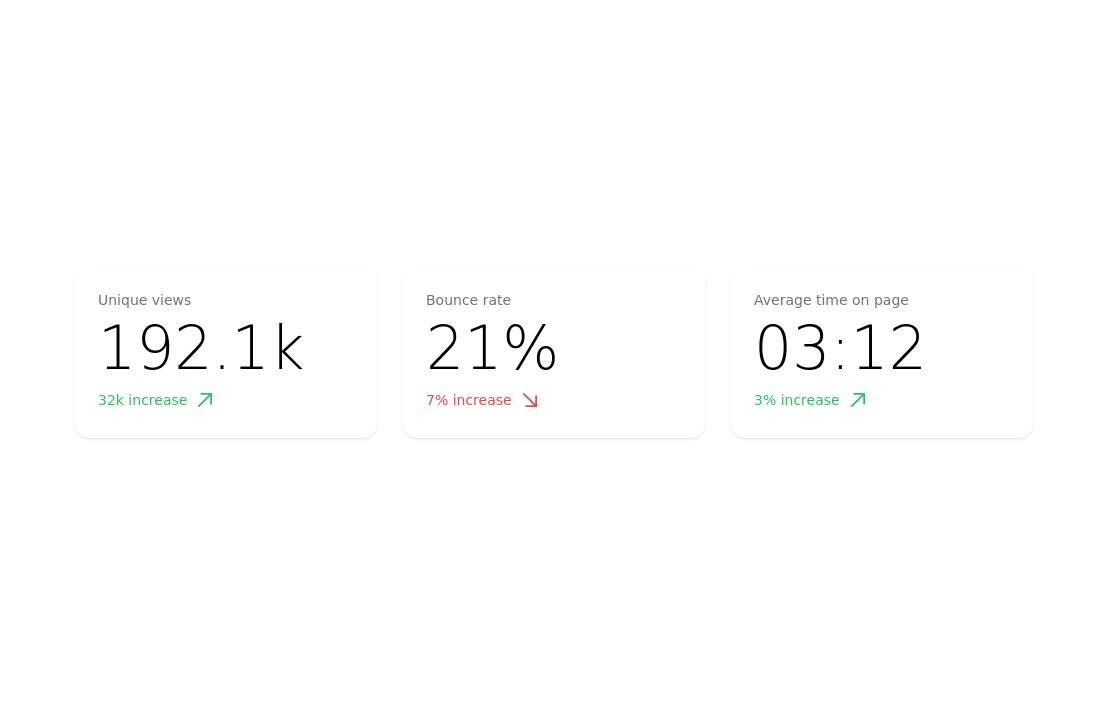
 Metrics overview cards
stat cards
2.9k -
 Engineering Project Dashboard
Track engineering assignments, project progress, technology stack, and delivery timelines in one simple dashboard.
540







Browse by topic
Explore components by Tags
Jump straight to the UI pattern you need.
Can't find it?
Didn't find the component you were looking for?
Search across 3,000+ community-built components and grab the code in seconds.