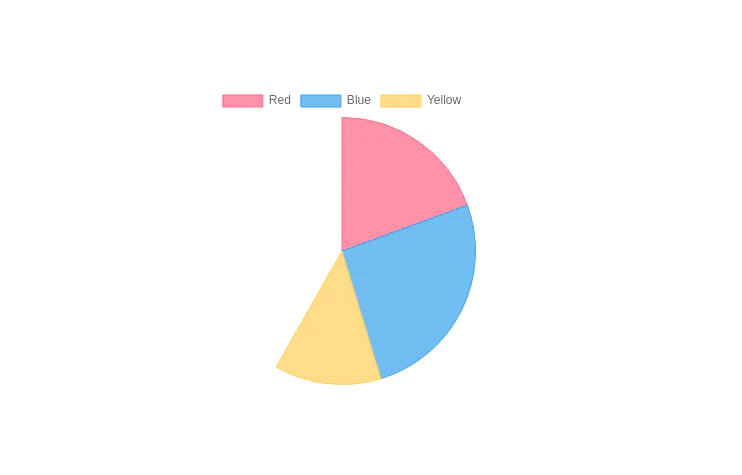
Infographic Component
Design a modern infographic component with Tailwind CSS. This component helps you display data in a clean, responsive, and visually appealing way. With utility classes, gradients, and smooth transitions, you can quickly build infographics that look professional and work perfectly on all devices.
This tailwind example is contributed by CodewithFaraz, on 01-Sep-2025. Component is made with Tailwind CSS v3. It is responsive. similar terms for this example are Graph,Admin Dashboard, User dashboard

Author CodewithFaraz
Related Examples
-
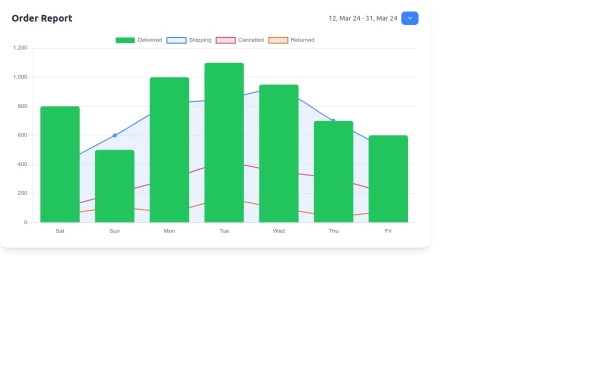 Interactive Order Report Chart with TailwindCSS and Chart.js
Create a stunning and interactive order report chart using HTML, TailwindCSS, and Chart.js. This chart combines bar and line graphs to visualize delivered, shipping, cancelled, and returned orders effectively. Perfect for dashboards and analytics pages with responsive design and clean aesthetics.
1 year ago1.6k -
 High-Performance Hotel Operations & AI Agent Testing Dashboard
A sophisticated, real-time command center designed for modern hotel management. This dashboard features deep integration for monitoring AI agent performance, guest sentiment, and room occupancy. Built with a "Mobile-First" philosophy, it demonstrates advanced data visualization, glassmorphism UI design, and a centralized state-management architecture. Perfect for showcasing full-stack capabilities in AI-driven automation.
1 month ago277 -
 Dash.OS: Drag & Drop Dashboard Widget System
A fully interactive, freeform dashboard builder for the browser. Drop in widgets, drag them anywhere, resize to fit, and your layout is automatically remembered. Ships with a live Chart.js revenue chart, KPI stats, a task tracker, and a notifications feed, all in a single zero-dependency HTML file with dark/light mode built in.
2 weeks ago148 -
 6 months ago807
 -
 4 months ago524
 -
 3 years ago15.2k
 -
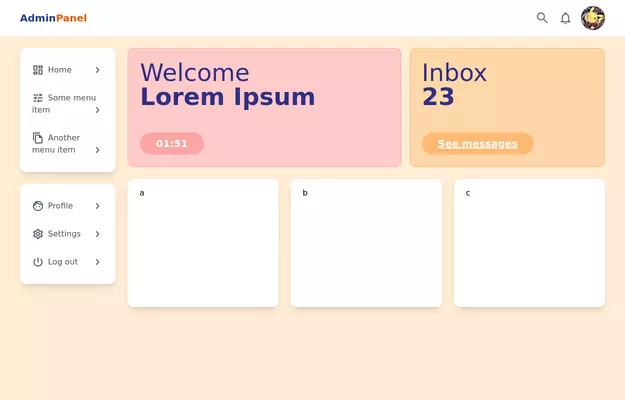
 Responsive Dashboard
1. Background Colors: 1. Main background: `bg-indigo-50` 2. Welcome card: `bg-indigo-100` with `border-indigo-200` 3. Inbox card: `bg-blue-100` with `border-blue-200` 4. Overlay: `bg-indigo-900/50` 2. Text Colors: 1. Header text: `text-indigo-800` 2. Logo: `text-blue-900` and `text-indigo-800` 3. Menu items hover: `hover:text-indigo-800` 4. Card headings: `text-blue-900` 3. Button/Badge Colors: 1. Welcome badge: `bg-indigo-800` 2. Inbox button: `bg-blue-800` with `hover:bg-blue-900` 3. Stats card titles: `text-indigo-800` 4. Maintained all functionality: 1. Responsive design 2. Animations and transitions 3. Mobile menu 4. Hover effects 5. Notification animation The color scheme now uses a mix of Indigo-800 and Blue-900 while maintaining visual hierarchy and accessibility. The colors create a professional and cohesive look across all components.
1 year ago4.5k -
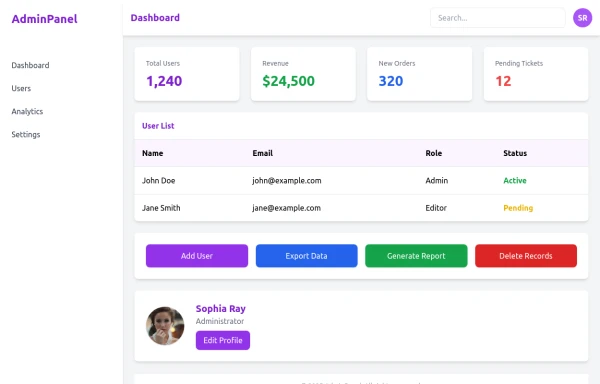 admin panel UI
Premium Admin Panel Pack including sidebar navigation, top navbar, dashboard cards, user tables, quick actions, profile section, and footer. Fully responsive with modern clean design using Tailwind CSS.
9 months ago1.9k -
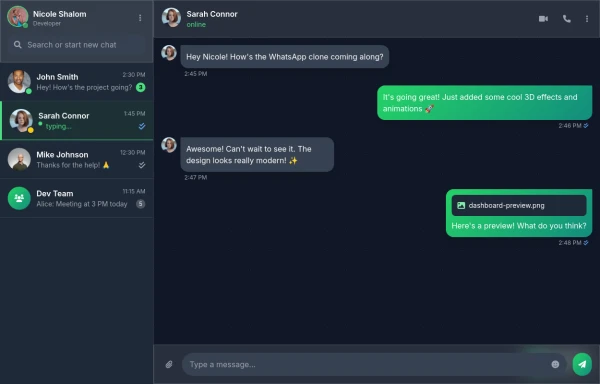 Best Chatting dashboard
create a modern WhatsApp-like chat dashboard with 3D effects, animations, and a sleek design. This will be a static view showcasing the interface with Nicole Shalom as the developer.
10 months ago1.3k -
 3 years ago13.4k
 -
 E-Voting Dashboard
For You
3 weeks ago159 -
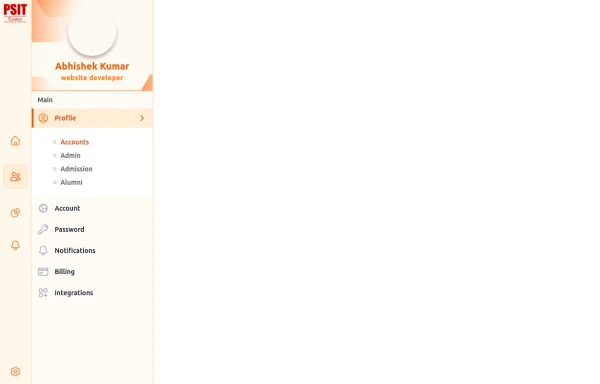
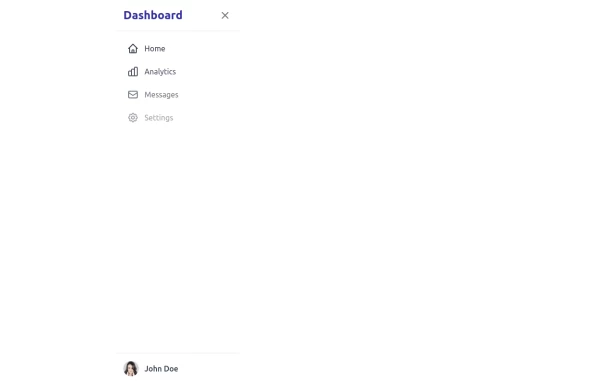 sidebar
This sidebar implementation includes: 1. Responsive design that works on both desktop and mobile 2. Indigo-800 and Blue-900 color scheme for the background 3. Dark mode support 4. Beautiful animations and effects: 1. Slide-in animation when opening the sidebar 2. Fade-in animation for menu items with staggered delays 3. Hover effects on menu items with underline animation 4. Smooth color transitions 5. SVG icons for menu items 6. User profile section at the bottom of the sidebar 7. Close button for easy dismissal on mobile 8. Main content area with a toggle button for the sidebar 9. Accessibility considerations (proper heading structure, color contrast, focus styles) Key features: - The background uses a gradient from Indigo-800 to Blue-900 - The sidebar has a white background in light mode and dark gray in dark mode - Text colors are adjusted for readability in both light and dark modes - Menu items have hover effects with background color changes and underline animations - Icons change color on hover - The sidebar slides in from the left with a smooth animation - Menu items fade in with a staggered delay for a smooth entrance - Dark mode is automatically applied based on system preferences - The layout is responsive, with the sidebar hiding off-screen on mobile and a toggle button to show/hide it This implementation provides a visually appealing and functional sidebar with various animations and effects, using HTML, Tailwind CSS, and vanilla JavaScript for the interactions.
1 year ago4.7k


Explore components by Tags
Didn't find component you were looking for?
Search from 3000+ components