Stats - Big and Bold
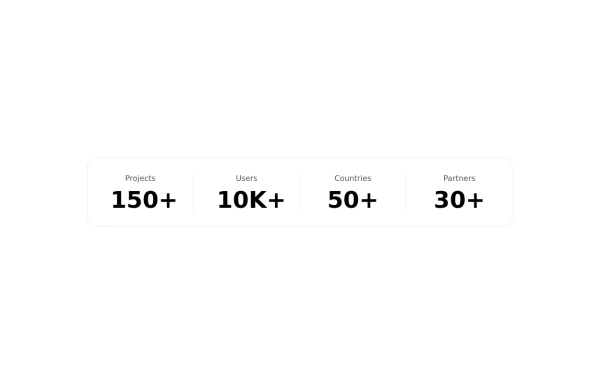
display stats of your product
This tailwind example is contributed by Pixel Perfect, on 17-Jun-2024. Component is made with Tailwind v3.4. It is responsive. It supports dark mode. similar terms for this example are Info, Show info, Statistics

Related Examples
-
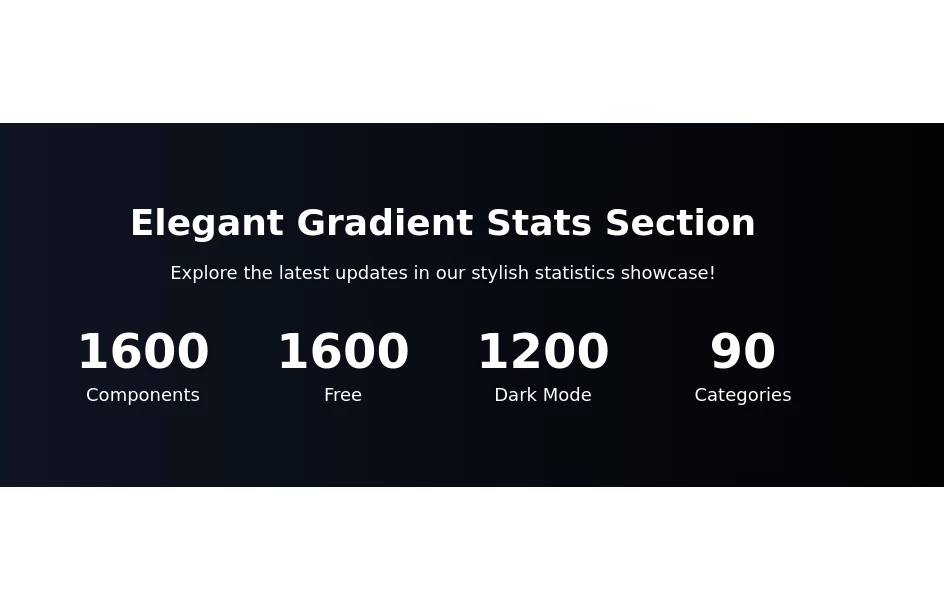
 Stats Banner Example
Show your stats proudly
2.8k -
-
-
-
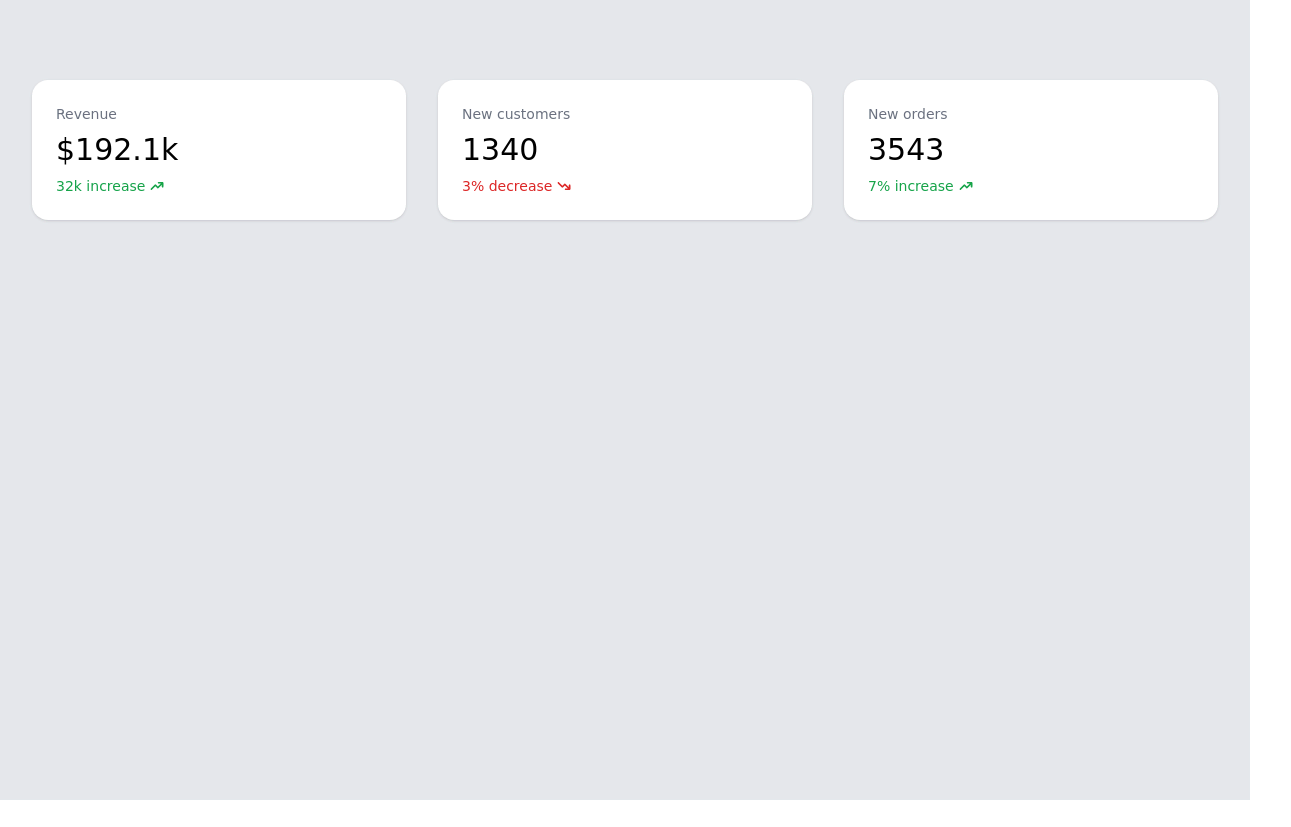 Responsive Info cards for admin panel
Show stats to the admin dashboard
12.9k -
 Tailwind stat cards
Highlight key statistics
11.1k -
-
-
 Stats cards for admin panel
This Component is designed to present statistics in a tile format. It comprises a title, a large numeric value, and an icon, creating an eye-catching way to display data.
-
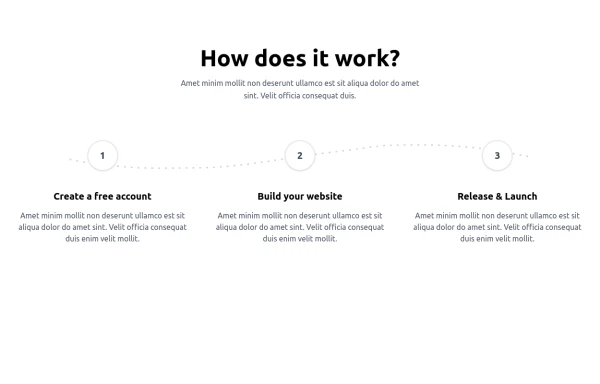
 How does it work Steps example
Dark themed steps section
8.7k -
 Engineering Project Dashboard
Track engineering assignments, project progress, technology stack, and delivery timelines in one simple dashboard.
537 -
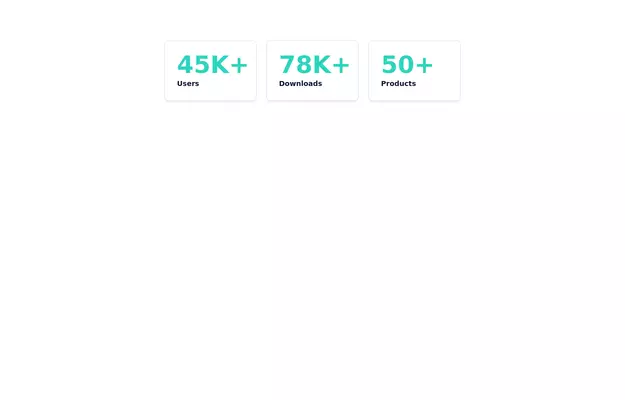 Info cards
Show various statistics on your website
12k









Browse by topic
Explore components by Tags
Jump straight to the UI pattern you need.
Can't find it?
Didn't find the component you were looking for?
Search across 3,000+ community-built components and grab the code in seconds.